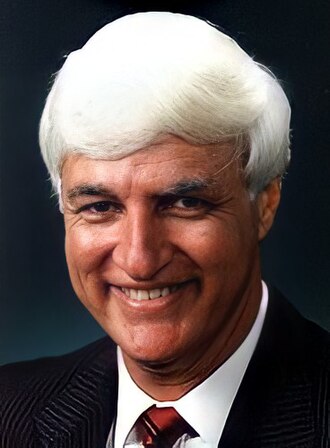
Federal Parliament · House of Representatives
Bob Katter
Member for Kennedy · Katter's Australian Party · QLD
Photo: Parliament@Work, CC BY-SA 3.0 au, via Wikimedia Commons

First preferences
40.4%
39,219 votes · -1.3 pts swing
After preferences
65.8%
Against Annette Swaine (LNP)
Winning margin
15.8 pts
A safe seat
How Kennedy voted · 2025 federal election
Bar colours show each candidate's party.
First preferences
How Kennedy voted · 2025 federal election, first preferences
Annette Swaine (LNP)23,135 votes,23.8%swing −4.4
Sharon Winn (ALP)15,917 votes,16.4%swing +0.3
Kate Harris (ONP)7,541 votes,7.8%swing +7.8
Carole Stanford (GRN)5,761 votes,5.9%swing −0.5
Mark Westcott (TP)2,283 votes,2.4%swing +2.4
Douglas Lush (FF)1,681 votes,1.7%swing +1.7
Steven Clare (IND)1,625 votes,1.7%swing +1.7
Bars show each candidate's share of formal first-preference votes on a 0–100% scale. Swing is the change in share, in percentage points, as published by the AEC.
After preferences (two-candidate preferred)
65.8%34.3%
The vertical line marks 50%.
Margin 15.8 pts (Katter's Australian): safe by the AEC's thresholds (under 6 points marginal, 6–10 fairly safe, over 10 safe). This describes this result, not a forecast.
Results as a table
| Candidate | Party | Votes | First pref. | Swing |
|---|---|---|---|---|
| Bob Katter | Katter's Australian Party (KAP) | 39,219 | 40.36% | -1.3 pts |
| Annette Swaine | LNP | 23,135 | 23.81% | -4.4 pts |
| Sharon Winn | Australian Labor Party | 15,917 | 16.38% | +0.3 pts |
| Kate Harris | Pauline Hanson's One Nation | 7,541 | 7.76% | +7.8 pts |
| Carole Stanford | The Greens | 5,761 | 5.93% | -0.5 pts |
| Mark Westcott | Trumpet of Patriots | 2,283 | 2.35% | +2.4 pts |
| Douglas Lush | Family First | 1,681 | 1.73% | +1.7 pts |
| Steven Clare | Independent | 1,625 | 1.67% | +1.7 pts |
Source: Australian Electoral Commission